Multiple Choice
FIGURE 8- 2 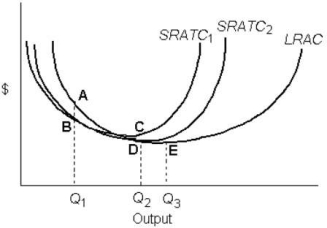
-Refer to Figure 8- 2.Decreasing returns to scale occur over the output range
A) Q2 to Q3 only.
B) 0 to Q3 only.
C) beyond Q3 only.
D) Q1 to Q2 only.
E) 0 to Q1 only.
Correct Answer:

Verified
Correct Answer:
Verified
Q17: TABLE 8-1<br> <img src="https://d2lvgg3v3hfg70.cloudfront.net/TB5441/.jpg" alt="TABLE 8-1
Q98: FIGURE 8- 4 <img src="https://d2lvgg3v3hfg70.cloudfront.net/TB5440/.jpg" alt="FIGURE 8-
Q99: Suppose that a firm is using 100
Q100: FIGURE 8- 4 <img src="https://d2lvgg3v3hfg70.cloudfront.net/TB5440/.jpg" alt="FIGURE 8-
Q101: A firm's long- run average cost curve<br>A)is
Q103: When there is no other way of
Q104: Suppose that a firm is using 100
Q105: Suppose that capital costs $100 per unit
Q106: Assume a firm is using 6 units
Q107: What is meant by the term "increasing