Multiple Choice
The figure below shows a family of cost curves for a firm.The subscripts 1,2,and 3 for the SRATC curves refer to different plant sizes.
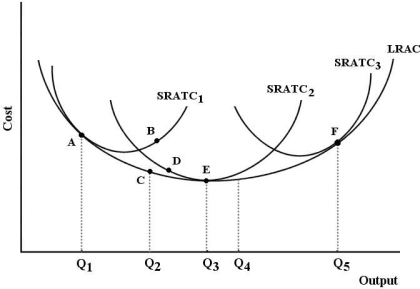 FIGURE 8- 3
-Refer to Figure 8- 3.Suppose this firm is producing output level Q3 with plant size 2.Now suppose this firm changes to plant size 3 and is producing output level Q5.We can say that
A) this firm has experienced economies of scale.
B) the firm is then operating with the optimal plant size.
C) output has increased less than in proportion to the increase in inputs.
D) output has increased more than in proportion to the increase in inputs.
E) output has increased exactly in proportion to the increase in inputs.
Correct Answer:

Verified
Correct Answer:
Verified
Q36: <img src="https://d2lvgg3v3hfg70.cloudfront.net/TB5441/.jpg" alt=" FIGURE 8-4 -Refer
Q52: What is the definition of productivity?<br>A)the efficient
Q53: In the long run,decreasing returns to scale
Q54: Suppose a firm employs two kinds of
Q55: Economists collect and analyze data on output
Q56: Assume a firm is using 10 units
Q58: Suppose a firm experiences decreasing returns to
Q59: Of the following,which is the least likely
Q60: Assume a firm is using 10 units
Q61: FIGURE 8- 4 <img src="https://d2lvgg3v3hfg70.cloudfront.net/TB5440/.jpg" alt="FIGURE 8-