Multiple Choice
The figure below shows the isocost lines and the isoquant map for a firm producing golf tees.
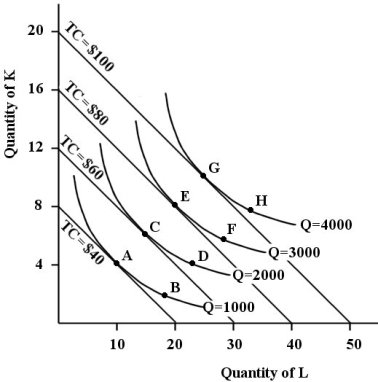 FIGURE 8- 6
-Refer to Figure 8- 6.As this firm is increasing its production of golf tees,it is experiencing returns to scale.
A) decreasing
B) diminishing
C) constant
D) increasing
E) Not determinable from the information provided.
Correct Answer:

Verified
Correct Answer:
Verified
Q10: TABLE 8-1<br> <img src="https://d2lvgg3v3hfg70.cloudfront.net/TB5441/.jpg" alt="TABLE 8-1
Q17: TABLE 8-1<br> <img src="https://d2lvgg3v3hfg70.cloudfront.net/TB5441/.jpg" alt="TABLE 8-1
Q91: Consider a firm in the long run
Q92: Suppose a firm is employing labour (L)and
Q93: Movement from one point to another along
Q94: Which of the following conditions indicate cost
Q96: Assume a firm is using 10 units
Q98: FIGURE 8- 4 <img src="https://d2lvgg3v3hfg70.cloudfront.net/TB5440/.jpg" alt="FIGURE 8-
Q99: Suppose that a firm is using 100
Q100: FIGURE 8- 4 <img src="https://d2lvgg3v3hfg70.cloudfront.net/TB5440/.jpg" alt="FIGURE 8-