Multiple Choice
The figures below show Chris's consumption of specialty coffee per week.
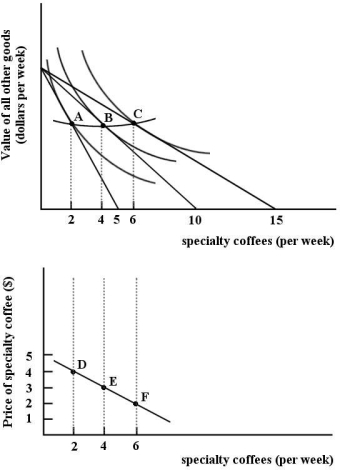 FIGURE 6- 10
-Refer to Figure 6- 10.The two diagrams in Figure 6- 10 are showing
A) that Chris is indifferent between bundles A,B and C.
B) the derivation of Chris's demand curve for specialty coffee.
C) the derivation of Chris's indifference curve for specialty coffee.
D) that Chris is indifferent between points D,E and F.
E) the change in Chris's preferences toward specialty coffee.
Correct Answer:

Verified
Correct Answer:
Verified
Q50: The table below shows the quantities
Q51: If John consumes only two goods,A and
Q52: At a garage sale,Dominique purchases a sewing
Q53: The paradox in "the paradox of value"
Q54: The demand curve for a good with
Q56: The "law" of diminishing marginal utility implies
Q57: The table below shows the total
Q58: Consider the income and substitution effects of
Q59: Consider a consumer who divides his income
Q60: Bjorn is a student with a monthly