Multiple Choice
FIGURE 2- 3 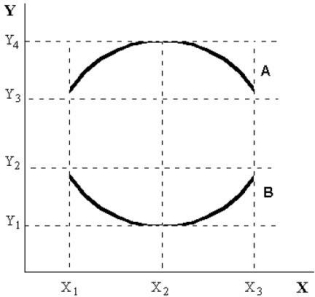
-Refer to Figure 2- 3.At X2 on curve A,the
A) minimum occurs at Y4.
B) slope is increasing.
C) slope of the curve is zero.
D) maximum occurs at Y1.
E) slope is decreasing.
Correct Answer:

Verified
Correct Answer:
Verified
Related Questions
Q38: As a science,economics is disadvantaged in that<br>A)some
Q39: The table below shows hypothetical data
Q40: The table below shows hypothetical per-
Q41: The table below shows hypothetical data
Q42: Suppose that over a 12- month period,Sonali's
Q44: Suppose that two points on a straight
Q45: The assumptions of a theory<br>A)are indirectly refuted
Q46: The table below shows hypothetical tuition
Q47: The slope of a curve is<br>A)always constant.<br>B)always
Q48: Suppose an economist tells you that the