Multiple Choice
The diagram below shows two production possibilities boundaries for Country X.
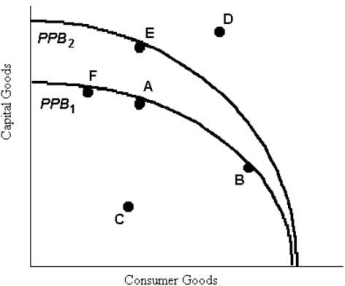 FIGURE 1- 4
-Refer to Figure 1- 4.Suppose that Country X is currently producing at point E.Country X could achieve production at point D if
A) firms reduced output of capital goods.
B) the given resources were fully employed.
C) sufficient improvements in technology occurred in either the capital goods industry or the consumer goods industries.
D) the given resources were more efficiently employed.
E) the prices of capital goods and consumption goods fell.
Correct Answer:

Verified
Correct Answer:
Verified
Q14: With regard to various economic systems,most economists
Q15: The table below shows that,in one
Q17: FIGURE 1- 1<br>With a budget of $200
Q18: FIGURE 1- 1<br>With a budget of $200
Q20: The table below illustrates that,in one
Q21: Suppose drought destroys many millions of acres
Q22: The downward- sloping line in the diagram
Q23: Consider the production possibilities boundary (PPB)of an
Q24: FIGURE 1- 5 ) <img src="https://d2lvgg3v3hfg70.cloudfront.net/TB5440/.jpg" alt="FIGURE
Q49: With a budget of $500 000,a school