Multiple Choice
The diagram below shows supply and demand curves for bicycles in the domestic Canadian market.Assume that all bicycles are identical. 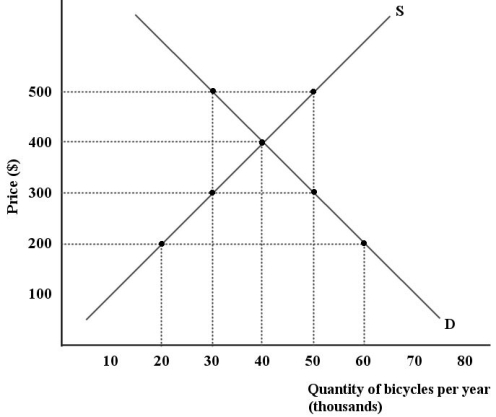 FIGURE 33-4
-Refer to Figure 33-4.Suppose the world price of bicycles is $200 and Canada has in place a 50% tariff on this good.The deadweight loss to the Canadian economy resulting from this tariff is ________ per year.
A) $0
B) $0.5 million
C) $1.0 million
D) $1.5 million
E) $2.0 million
Correct Answer:

Verified
Correct Answer:
Verified
Q28: Continued tariff protection for industries that have
Q45: Over the long run,protecting a domestic industry
Q83: A country that implements a voluntary export
Q84: The diagram below shows the domestic demand
Q85: If a country is small in world
Q86: The diagram below shows the domestic demand
Q89: Suppose the Canadian government began subsidizing wheat
Q91: The diagram below shows the demand and
Q100: Suppose Canada implements new border procedures that
Q112: Consider the following statement: "Canada is unambiguously