Multiple Choice
The diagram below shows two budget deficit functions for a hypothetical economy.
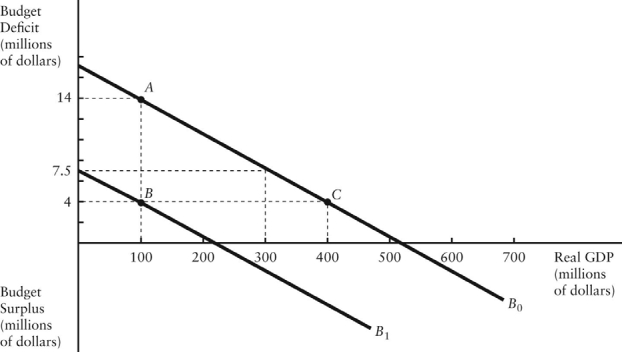 FIGURE 31-2
-Refer to Figure 31-2.Initially,suppose the economy is at point A on budget deficit function B0.Real GDP (Y) is $100 million.If the level of potential output (Y*) were $300 million,the structural budget deficit would be
A) $4 million.
B) $6.5 million.
C) $7.5 million.
D) $14 million.
E) Insufficient information to know.
Correct Answer:

Verified
Correct Answer:
Verified
Q6: The diagram below shows two budget deficit
Q26: Suppose during one fiscal year,government purchases are
Q30: If we want to know whether tax
Q41: The government's primary budget deficit (or surplus)is
Q86: The Canadian tax and transfer system acts
Q87: Consider a closed-economy AD/AS model.If an increase
Q94: The extent to which tax revenues are
Q98: Annually balanced government budgets<br>A)are easy to implement
Q101: Consider the following variables: G = government
Q106: Suppose the government's budget deficit falls from