Multiple Choice
The diagram below shows an AD/AS model for a hypothetical economy.The economy begins in long-run equilibrium at point A.
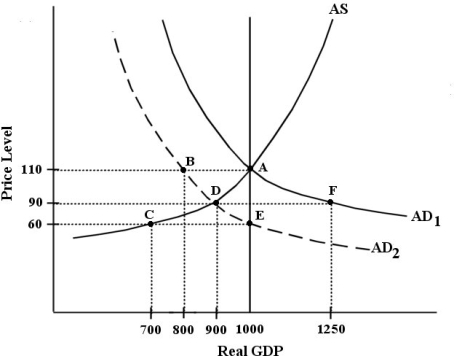 FIGURE 24-3
-Refer to Figure 24-3.After the negative aggregate demand shock shown in the diagram (from AD1 to AD2) ,which of the following describes the adjustment process that would return the economy to its long -run equilibrium?
A) Wages would eventually fall,causing the AD curve to shift to the right,returning to the original equilibrium at point A.
B) Wages would eventually fall,causing the AS curve to shift slowly to the right,reaching a new equilibrium at point E.
C) Wages would increase,causing the AS curve to shift to the right,reaching a new equilibrium at point E.
D) Wages would increase,causing the AD curve to shift to the right,returning to the original equilibrium at point A.
E) Potential output would decrease from 1000 to 900 and a new long -run equilibrium would be established at point D.
Correct Answer:

Verified
Correct Answer:
Verified
Q33: As a global recession began in late
Q36: The diagram below shows an AD/AS model
Q37: Consider the AD/AS macro model.A permanent demand
Q56: Consider the AD/AS model after factor prices
Q67: Suppose the government had made a decision
Q87: Consider the basic AD/AS macro model in
Q89: Automatic fiscal stabilizers _ the impact of
Q102: In any decision about stimulating the economy
Q133: Consider the AD/AS macro model.The study of
Q140: The table below shows data for five