Multiple Choice
The diagram below shows an AD/AS model for a hypothetical economy.The economy begins in long-run equilibrium at point A.
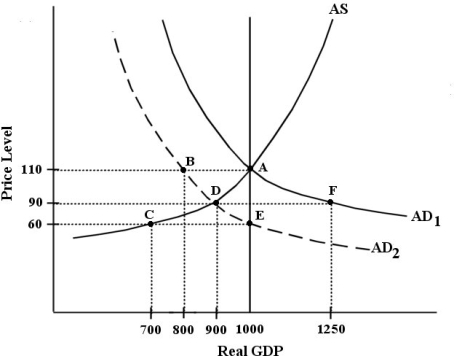 FIGURE 24-3
-Refer to Figure 24-3. Following the negative AD shock shown in the diagram (from AD1 to AD2) , the adjustment process will take the economy to a long-run equilibrium where the price level is ________ and real GDP is ________.
A) 110; 1000
B) 60; 1000
C) 90; 900
D) 110; 800
E) 90; 1250
Correct Answer:

Verified
Correct Answer:
Verified
Q15: Suppose Canada's economy is in a long-run
Q27: Fiscal policies typically affect the short-run level
Q33: As a global recession began in late
Q39: A common assumption among macroeconomists is that
Q43: When we study the adjustment process in
Q44: Consider the basic AD/AS macro model in
Q91: Suppose Canada's economy is in a long-run
Q95: Consider the AD/AS model and suppose the
Q107: The paradox of thrift does not exist
Q118: In the basic AD/AS macro model,the "paradox