menu-iconExamlexExamLexServices

Discover

Ask a Question
  1. All Topics
  2. Topic
    Business
  3. Study Set
    Economics Study Set 1
  4. Exam
    Exam 20: The Measurement of National Income
  5. Question
    The Table Below Shows Total Output for an Economy Over
Solved

The Table Below Shows Total Output for an Economy Over

Question 22

Question 22

Multiple Choice

The table below shows total output for an economy over 2 years.
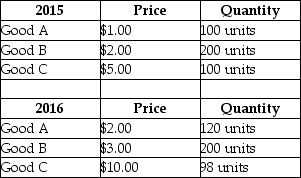
The table below shows total output for an economy over 2 years.    TABLE 20-5 -Refer to Table 20-5.The real GDP in 2016,expressed in 2015 prices,was A) $700. B) $840. C) $970. D) $1010. E) $1740. TABLE 20-5
-Refer to Table 20-5.The real GDP in 2016,expressed in 2015 prices,was


A) $700.
B) $840.
C) $970.
D) $1010.
E) $1740.

Correct Answer:

verifed

Verified

Unlock this answer now
Get Access to more Verified Answers free of charge

Related Questions

Q3: To calculate GDP from the income side,one

Q18: The table below shows total output for

Q19: When calculating GDP from the expenditure side,G<sub>a</sub>

Q19: Consider a firm producing skateboards in one

Q20: Consider the circular flow of income and

Q26: When calculating GDP from the expenditure side,which

Q32: Consider Canada's GDP deflator and Consumer Price

Q41: Consider Canada's GDP deflator and Consumer Price

Q64: Historically,nominal GDP has increased faster than real

Q72: In national-income accounting,the term "fixed investment" refers

Examlex

ExamLex

About UsContact UsPerks CenterHomeschoolingTest Prep

Work With Us

Campus RepresentativeInfluencers

Links

FaqPricingChrome Extension

Download The App

Get App StoreGet Google Play

Policies

Privacy PolicyTerms of ServiceHonor CodeCommunity Guidelines

Scan To Download

qr-code

Copyright © (2025) ExamLex LLC.

Privacy PolicyTerms Of ServiceHonor CodeCommunity Guidelines