Multiple Choice
The diagram below shows the marginal cost of pollution abatement for two firms,Firm X and Firm Y.
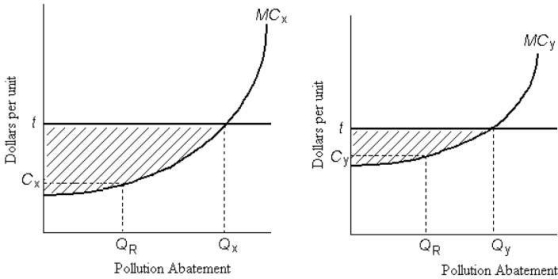 FIGURE 17-6
-Refer to Figure 17-6.Firms X and Y have an emissions tax of $t imposed on each unit of pollution they produce.If Firm X chooses to abate QX units of pollution,the total cost of its abatement is
A) tax amount t multiplied by the maximum possible level of pollution abatement.
B) area beneath the marginal cost of pollution abatement curve.
C) area below the horizontal line at t and above the MC of pollution abatement curve.
D) tax amount t multiplied by the level of pollution abatement,QX.
E) area beneath the marginal cost of pollution abatement curve up to QX.
Correct Answer:

Verified
Correct Answer:
Verified
Q2: The figure below shows the marginal benefit
Q4: The diagram below shows the marginal costs
Q5: The diagram below shows the marginal cost
Q8: Consider the following equation: <br><img src="https://d2lvgg3v3hfg70.cloudfront.net/TB2891/.jpg" alt="Consider
Q9: A paper mill discharges chemicals into a
Q10: The diagram below shows the marginal costs
Q11: The diagram below shows the marginal cost
Q45: Consider a coal-fired electric-power plant that is
Q68: The marginal benefit of reducing pollution in
Q108: The table below shows the marginal benefit