Multiple Choice
The diagram below shows the MRP curve for a firm producing copper plumbing pipe.The factor of production being considered here is hours of labour.
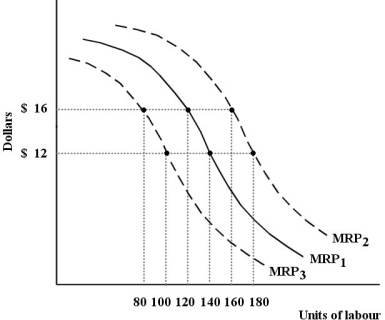 FIGURE 13-1
-Refer to Figure 13-1.Suppose this firm initially has the marginal revenue product curve MRP1.One reason that the curve could shift to MRP3 is
A) an increase in demand for the firmʹs output,copper plumbing pipe.
B) a decrease in the market price of copper plumbing pipe.
C) a decrease in the supply of labour.
D) an increase in the wage rate.
E) an increase in the marginal product of labour.
Correct Answer:

Verified
Correct Answer:
Verified
Q14: The diagram below shows the MRP curve
Q29: Consider the following production and cost schedule
Q30: The term "economic rent" refers to<br>A)a payment
Q35: Consider the following production and cost schedule
Q45: Consider labour hired for $18 per hour.If
Q54: The marginal revenue product curve for a
Q67: Consider labour that is hired for $18
Q71: Consider the following production and cost schedule
Q95: Consider computer programmers as a factor of
Q115: When the wage paid to workers in