Multiple Choice
The diagram below shows the market demand curve and the cost curves for a single firm.
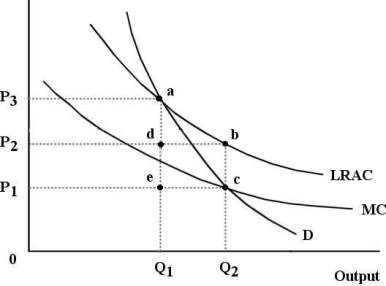 FIGURE 12-6
-Refer to Figure 12-6.Suppose this firm is a government-owned natural monopoly and imposes a price so as to achieve allocative efficiency in this market.The amount of tax revenue that the government must raise elsewhere in the economy to offset the losses of this firm is represented by the area
A) P1P3ae.
B) P1P2bc.
C) edbc.
D) Q1dbQ2.
E) 0P2bQ2.
Correct Answer:

Verified
Correct Answer:
Verified
Q1: Suppose your municipality charges your household a
Q19: In which of the following situations would
Q44: The diagram below shows the market demand
Q62: At the level of the industry,the condition
Q64: Consider a monopolistically competitive industry in long-run
Q83: In Canada,a significant challenge for the Competition
Q87: Consider two firms,A and B,that are producing
Q90: Suppose there are only two firms (Firms
Q93: Consider two firms,A and B,that are producing
Q108: Consider the efficiency of various market structures