Multiple Choice
The figure below shows a family of cost curves for a firm.The subscripts 1,2,and 3 for the SRATC curves refer to different plant sizes.
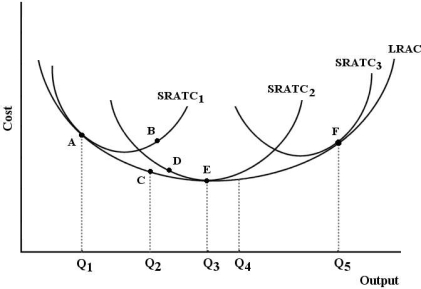 FIGURE 8-3
-Refer to Figure 8-3.Should this profit-maximizing firm ever consider moving from point E (output level Q3 on SRATC2) to point F (output level Q5 on SRATC3) ?
A) No,because they are already producing at their lowest possible cost at point E.
B) Yes,because the firm can take advantage of economies of scale.
C) Yes,because SRATC3 is the optimal plant size for this firm.
D) No,because producing at point F implies a higher cost per unit of output.
E) Yes,if the product price rises enough to lead the firm to expand to plant size 3.
Correct Answer:

Verified
Correct Answer:
Verified
Q21: Isoquants are usually drawn convex when viewed
Q46: For many firms the LRAC curve is
Q48: The principle of substitution plays a central
Q51: Consider a firm that uses only labour
Q57: A firm's long-run average cost curve<br>A)shows the
Q68: A firm operates at its least-cost position
Q72: The long-run average cost (LRAC)curve shows<br>A)the lowest
Q107: A profit-maximizing firm will increase its use
Q125: Suppose Farmer Smith hires 4 workers and
Q129: Canada has a much lower population density