Multiple Choice
The diagram below shows some short-run cost curves for a firm. 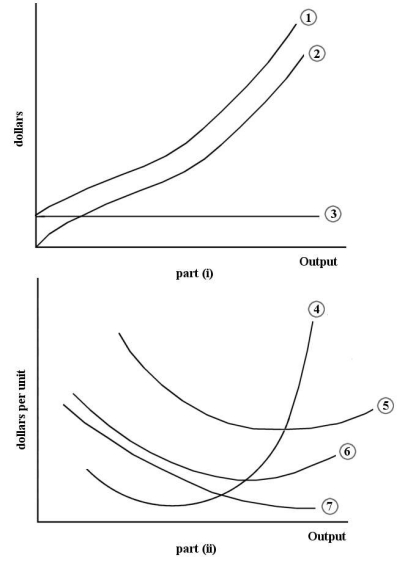 FIGURE 7-2
-Refer to Figure 7-2.Which of the following choices correctly identifies the cost curves in part (i) of the figure?
A) Curve 1 is the total cost curve. Curve 2 is the total variable cost curve.
Curve 3 is the total fixed cost curve.
B) Curve 1 is the total fixed cost curve. Curve 2 is the total variable cost curve.
Curve 3 is the total cost curve.
C) Curve 1 is the total variable cost curve. Curve 2 is the total cost curve.
Curve 3 is the total fixed cost curve.
D) Curve 1 is the total marginal cost curve. Curve 2 is the total average cost curve.
Curve 3 is the total average fixed cost curve.
E) Curve 1 is the total cost curve. Curve 2 is the total variable cost curve.
Curve 3 is the average fixed cost curve.
Correct Answer:

Verified
Correct Answer:
Verified
Q35: Suppose Jodi's widget business is using two
Q36: Suppose NHL hockey player Jarome Iginla is
Q37: <img src="https://d2lvgg3v3hfg70.cloudfront.net/TB5441/.jpg" alt=" FIGURE 7-1 -Refer
Q38: The period of time over which all
Q39: "An objective of firms is to maximize
Q41: Suppose a firm is producing 100 units
Q42: Consider the short-run costs of a firm.Suppose
Q43: Consider a firm's short-run cost curves.If average
Q44: The table below provides the annual revenues
Q45: The following data show the total output