Multiple Choice
The table below shows hypothetical per-minute cell phone charges for "pay-and-talk" service over several years.
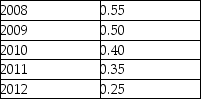 TABLE 2-2
-Refer to Table 2-2.Assume that 2008 is used as the base year,with the index number = 100.Which of the following series is the correct set of index numbers for the per-minute cell phone charges from 2008 to 2012?
A) 0.55; 0.50; 0.40; 0.35; 0.25
B) 100; 91; 73; 64; 45
C) 55; 50; 40; 35; 25
D) 1.0; 0.91; 0.73; 0.64; 0.45
E) 100%; 91%; 73%; 64%; 45%
Correct Answer:

Verified
Correct Answer:
Verified
Q2: Suppose there is a linear relationship between
Q44: According to the Bank of Canada's website,Canada's
Q46: Choose the statement that best describes how
Q51: The table below shows the approximate value
Q52: <img src="https://d2lvgg3v3hfg70.cloudfront.net/TB5441/.jpg" alt=" FIGURE 2-1 -Refer
Q53: <img src="https://d2lvgg3v3hfg70.cloudfront.net/TB5441/.jpg" alt=" FIGURE 2-4 -Refer
Q64: When it is said that variable A
Q70: The mathematical expression of a relationship between
Q71: The statement that a 2% increase in
Q108: The scientific approach to economic inquiry involves<br>A)choosing