Multiple Choice
The diagram below shows two production possibilities boundaries for Country X.
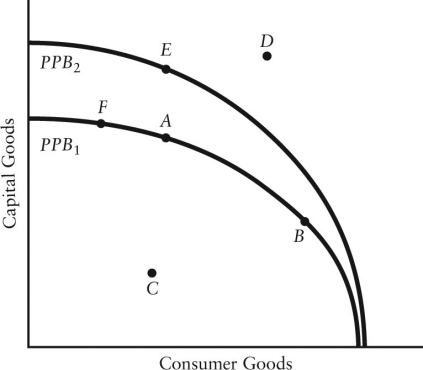 FIGURE 1-4
-Refer to Figure 1-4.An outward shift of the production possibilities boundary fromPPB1 to PPB2 indicates which of the following?
A) an increase in the price of raw materials for consumer goods
B) growth in the countryʹs productive capacity
C) an increase in the price of raw material for capital goods
D) more of the countryʹs resources are being used
E) the countryʹs resources are being used less efficiently
Correct Answer:

Verified
Correct Answer:
Verified
Q26: It has been observed that university enrollment
Q28: Suppose you own a courier service and
Q33: A greater specialization of labour leads to
Q39: The diagram below shows two production possibilities
Q56: Consider Canada's production possibilities boundary.Suppose a scientific
Q57: In practice,the term "centrally planned economy" refers
Q76: In command economies,economic behaviour is<br>A)largely determined by
Q107: Suppose there are only three alternatives to
Q127: Which of the following results from the
Q129: Consider the production possibilities boundary (PPB)of an