Multiple Choice
The table below shows data for the U.S. 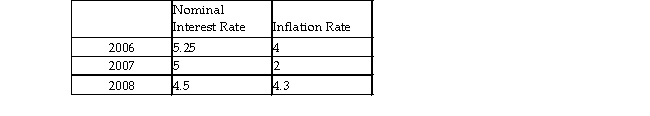 Between 2007 and 2008 the real interest rate _ and caused a the demand for loana funds curve.
A) increased; movement up along.
B) decreased; leftward shift.
C) decreased; movement down along.
D) increased; rightward shift.
Correct Answer:

Verified
Correct Answer:
Verified
Q144: Approximately, the real interest rate the inflation
Q145: Suppose a firm has an investment project
Q146: Which of the following explains why the
Q147: The crowding out effect refers to<br>A) government
Q148: <img src="https://d2lvgg3v3hfg70.cloudfront.net/TB5270/.jpg" alt=" -In the above
Q150: A country's investment can be financed by
Q151: Which of the following will shift the
Q152: In January 2008, Tim's Gyms, Inc. owned
Q153: In November 2008, automobile executives from Ford,
Q154: A government budget deficit the demand for