Multiple Choice
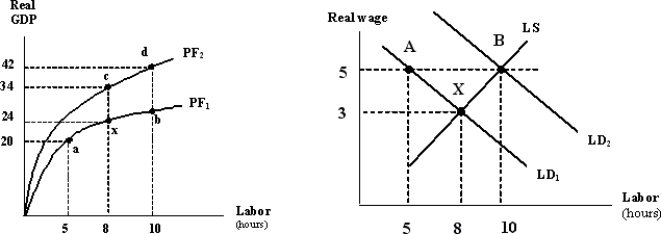
The graphs below depict the production function and labor market for an imaginary economy. The economy is, initially, at points x and X.
 Figure 1 Figure 2
-An advance in technology shifts the production function upward and shifts the labor
A) demand curve rightward.
B) supply curve rightward.
C) demand curve leftward.
D) supply curve leftward.
Correct Answer:

Verified
Correct Answer:
Verified
Q111: What happens to the real wage rate
Q223: Because of the choices people make in
Q224: A productivity growth slowdown can be the
Q225: Suppose a graph shows labor productivity in
Q226: The one- third rule states that, holding
Q228: "Why India Cannot Sustain High Economic Growth",
Q229: Which of the following policies improves prospects
Q230: The real wage rate can best be
Q231: One reason for the productivity growth slowdown
Q232: In Lotusland, real GDP per hour of