Multiple Choice
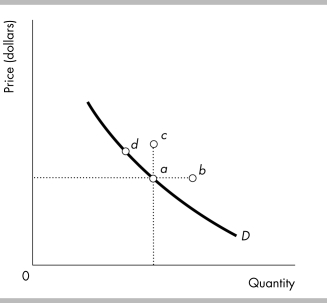
-In the above figure, an increase in the quantity demanded is represented by a movement from point d to
A) point a.
B) point c only.
C) point b only.
D) both points b and c.
Correct Answer:

Verified
Correct Answer:
Verified
Q33: <img src="https://d2lvgg3v3hfg70.cloudfront.net/TB8586/.jpg" alt=" -In the figure
Q94: A movement along the demand curve shows
Q178: <img src="https://d2lvgg3v3hfg70.cloudfront.net/TB5270/.jpg" alt=" -Consider the figure
Q179: A normal good is a good for
Q180: Which of the following shifts the demand
Q182: <img src="https://d2lvgg3v3hfg70.cloudfront.net/TB5270/.jpg" alt=" -In the figure
Q185: If the U.S. Surgeon General announced that
Q186: <img src="https://d2lvgg3v3hfg70.cloudfront.net/TB5270/.jpg" alt=" -Refer to the
Q355: Crude oil can be refined into home
Q451: When the demand for blue jeans increases,