Multiple Choice
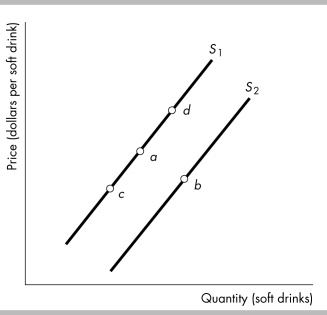
-Consider the figure above showing supply curves for soft drinks. Suppose the economy is at point
A. An increase in the number of suppliers would be shown as a movement from point a to a point such as
A) none of the points that are illustrated.
B) point b.
C) point c.
D) point d.
Correct Answer:

Verified
Correct Answer:
Verified
Q254: For consumers, chocolate chip cookies and doughnuts
Q512: Joe pays $8,000.00 in tuition. The 8,000
Q513: When the price of a pizza decreases
Q514: <img src="https://d2lvgg3v3hfg70.cloudfront.net/TB5270/.jpg" alt=" -The above table
Q515: <img src="https://d2lvgg3v3hfg70.cloudfront.net/TB5270/.jpg" alt=" -The figure above
Q517: If the quantity demanded exceeds the quantity
Q518: An unusually warm winter shifts the<br>A) supply
Q519: A relative price is<br>A) also called the
Q520: Each point on a supply curve represents<br>A)
Q521: Each point on the demand curve reflects<br>A)