Multiple Choice
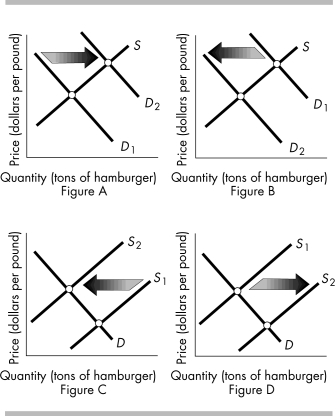
-The above figures show the market for hamburger meat. Which figure(s) shows the effect when more farmers decide to raise cows that are processed into hamburger meat?
A) Figure A
B) Figure B
C) Figure C
D) Figure D
Correct Answer:

Verified
Correct Answer:
Verified
Q413: If the price per bushel of apples
Q414: Demand is the<br>A) ability to pay for
Q415: Which of the following would increase the
Q416: <img src="https://d2lvgg3v3hfg70.cloudfront.net/TB5270/.jpg" alt=" -The diagram above
Q417: <img src="https://d2lvgg3v3hfg70.cloudfront.net/TB5270/.jpg" alt=" -In the above
Q419: A substitute is a good<br>A) of higher
Q420: <img src="https://d2lvgg3v3hfg70.cloudfront.net/TB5270/.jpg" alt=" -The above table
Q421: <img src="https://d2lvgg3v3hfg70.cloudfront.net/TB5270/.jpg" alt=" -In the figure
Q422: A change in which of the following
Q423: In early 2008 the price of gasoline