Multiple Choice
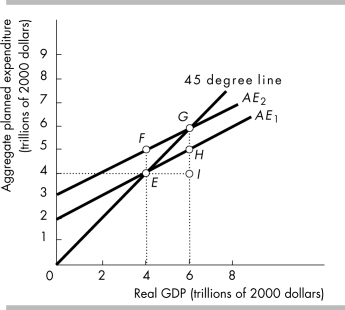
-In the above figure, an increase in autonomous expenditure is depicted by the movement from point E to
A) point H.
B) point F.
C) point G.
D) point I.
Correct Answer:

Verified
Correct Answer:
Verified
Related Questions
Q214: What is the relationship between the aggregate
Q320: A movement along the saving function occurs
Q322: The short- run multiplier is equal to
Q323: <img src="https://d2lvgg3v3hfg70.cloudfront.net/TB5270/.jpg" alt=" -In the figure
Q324: <img src="https://d2lvgg3v3hfg70.cloudfront.net/TB5270/.jpg" alt=" -In the above
Q326: If real disposable income increases by $1500,
Q327: The curve that relates the level of
Q328: Suppose real GDP increases from $9 trillion
Q329: Any change in the price level will
Q330: Since 1968, U.S. consumption function has generally