Multiple Choice
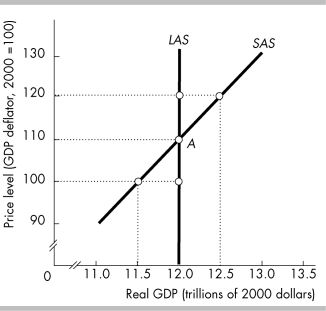
-In the figure above, the economy is at point A when the price level falls to 100. Money wage rates and all other resource prices remain constant. Firms are willing to supply output equal to
A) $11.5 trillion.
B) $12.5 trillion.
C) $12.0 trillion.
D) None of the above answers is correct.
Correct Answer:

Verified
Correct Answer:
Verified
Q16: An increase in the quantity of money
Q78: An increase in aggregate demand is shown
Q79: Moving upward along the SAS results in
Q80: In the first half of 2008, food
Q82: An above full- employment equilibrium is<br>A) a
Q85: <img src="https://d2lvgg3v3hfg70.cloudfront.net/TB5270/.jpg" alt=" -In the above
Q86: The Great Depression, in which real GDP
Q87: If the price level in Great Britain
Q88: The long- run aggregate supply curve is
Q148: In the aggregate demand-aggregate supply framework, how