Multiple Choice
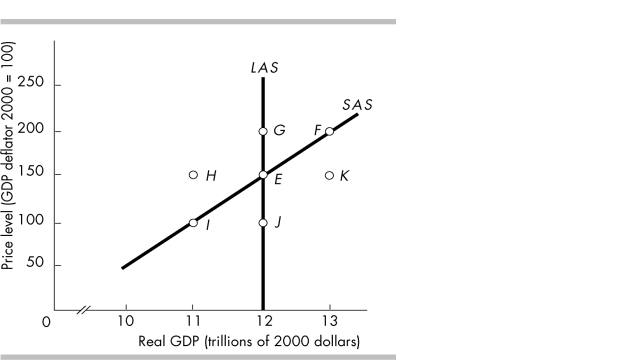
-In the above figure, which movement illustrates the impact of the price level and money wage rate falling at the same rate?
A) E to J
B) E to K
C) E to H
D) E to G
Correct Answer:

Verified
Correct Answer:
Verified
Q321: According to the intertemporal substitution effect, when
Q322: If the economy is in long run
Q323: Higher taxes<br>A) increase the aggregate quantity demanded.<br>B)
Q324: In the short- run, a rise in
Q325: Suppose there is a temporary increase in
Q327: In long- run macroeconomic equilibrium,<br>A) real GDP
Q328: The intertemporal substitution effect refers to substitution
Q329: <img src="https://d2lvgg3v3hfg70.cloudfront.net/TB5270/.jpg" alt=" -In the above
Q330: <img src="https://d2lvgg3v3hfg70.cloudfront.net/TB5270/.jpg" alt=" -In the above
Q331: China is one of the world's largest