Multiple Choice
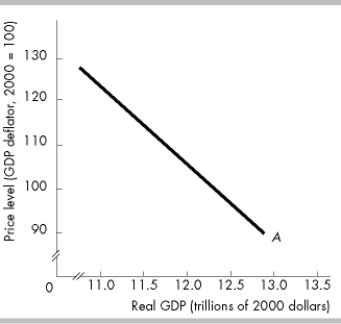
-The curve labeled A in the above figure is
A) a production possibilities curve.
B) a short- run aggregate supply curve.
C) an aggregate demand curve.
D) a long- run aggregate supply curve.
Correct Answer:

Verified
Correct Answer:
Verified
Q44: If the world economy expands so that
Q187: Which of the following shifts the aggregate
Q188: <img src="https://d2lvgg3v3hfg70.cloudfront.net/TB5270/.jpg" alt=" -In the above
Q189: <img src="https://d2lvgg3v3hfg70.cloudfront.net/TB5270/.jpg" alt=" -The data in
Q190: The equilibrium level of GDP occurs at
Q193: <img src="https://d2lvgg3v3hfg70.cloudfront.net/TB5270/.jpg" alt=" -In the above
Q194: A decrease in the quantity of money<br>A)
Q195: When the economy is at an above
Q196: The short- run aggregate supply curve shifts
Q244: In the short run, a supply shock