Multiple Choice
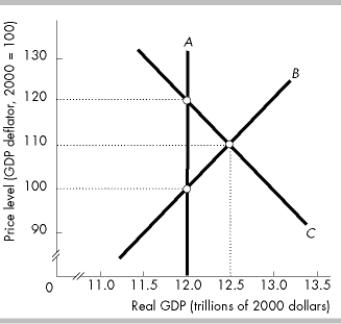
-In the above figure, curve A is the curve, curve B is the curve, and curve C is the
Curve.
A) long- run aggregate supply; short- run aggregate supply; aggregate demand
B) long- run aggregate supply; aggregate demand; short- run aggregate supply
C) short- run aggregate supply; long- run aggregate supply; aggregate demand
D) aggregate demand; short- run aggregate supply; long- run aggregate supply
Correct Answer:

Verified
Correct Answer:
Verified
Q29: <img src="https://d2lvgg3v3hfg70.cloudfront.net/TB5270/.jpg" alt=" -In the above
Q30: In the above figure, when the economy
Q31: Which of the following shifts both the
Q33: The quantity of real GDP supplied at
Q35: The table above gives the aggregate demand
Q36: <img src="https://d2lvgg3v3hfg70.cloudfront.net/TB5270/.jpg" alt=" -The data in
Q37: When the prices of U.S.- produced goods
Q129: If there is an increase in technology,
Q163: If taxes are increased, the AD curve<br>A)
Q200: Wealth and substitution effects explain why the