Multiple Choice
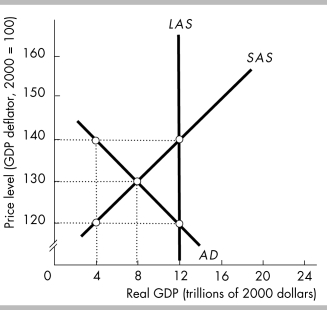
-The data in the above figure indicate that the economy will be in a long- run macroeconomic equilibrium at a price level of
A) 120.
B) 130.
C) 100.
D) 140.
Correct Answer:

Verified
Correct Answer:
Verified
Related Questions
Q303: <img src="https://d2lvgg3v3hfg70.cloudfront.net/TB6802/.jpg" alt=" -In the above
Q319: What are the factors that can shift
Q381: Which of the following changes does NOT
Q382: <img src="https://d2lvgg3v3hfg70.cloudfront.net/TB5270/.jpg" alt=" -In the above
Q383: An aggregate supply curve depicts the relationship
Q384: Which of the following changes does NOT
Q385: Other things constant, the economy's aggregate demand
Q388: According to the wealth effect, an increase
Q389: By using only the aggregate demand curve,
Q391: Aggregate demand is the relationship between the