Multiple Choice
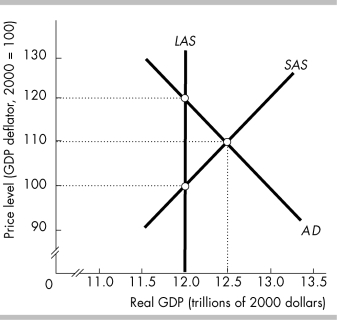
-The above figure illustrates
A) a full- employment equilibrium.
B) an equilibrium at the economy's physical limits.
C) an inflationary gap.
D) a recessionary gap.
Correct Answer:

Verified
Correct Answer:
Verified
Related Questions
Q105: What are the components of fiscal policy?
Q133: What two variables are determined in an
Q237: What are the substitution effects that affect
Q252: A change in which of the following
Q253: Inflation occurs over time as a result
Q254: Which of the following shifts the aggregate
Q255: Along a short- run aggregate supply curve,
Q257: <img src="https://d2lvgg3v3hfg70.cloudfront.net/TB5270/.jpg" alt=" -In the above
Q261: In the short run, the aggregate supply
Q324: The wealth effect points out that consumption