Multiple Choice
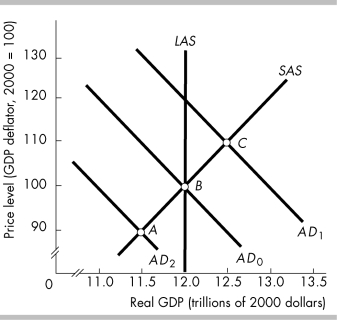
-In the above figure, point C represents
A) a full- employment equilibrium.
B) an inflationary gap.
C) a recessionary gap.
D) a decrease in aggregate demand.
Correct Answer:

Verified
Correct Answer:
Verified
Related Questions
Q16: An increase in the money wage rate<br>A)
Q221: Long- run aggregate supply will decrease for
Q222: An increase in expected future income<br>A) increases
Q223: A change in creates a movement along
Q224: The country of Stanley is at an
Q226: An increase in government expenditure on goods
Q227: As the price level falls, the quantity
Q229: <img src="https://d2lvgg3v3hfg70.cloudfront.net/TB5270/.jpg" alt=" -In the above
Q230: <img src="https://d2lvgg3v3hfg70.cloudfront.net/TB5270/.jpg" alt=" -The data in
Q310: The price level in India increases from