Multiple Choice
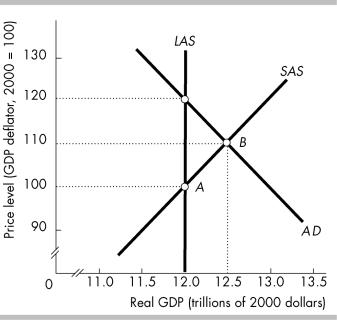
-In the above figure, suppose the economy had been at point A and now is at B. What could have lead to the movement to B?
A) A tax hike.
B) Money wage rates rose.
C) Government expenditures on goods and services increased.
D) Winter storms cause factories in the north to be shut down for several weeks.
Correct Answer:

Verified
Correct Answer:
Verified
Q32: The aggregate demand curve shows that, if
Q103: <img src="https://d2lvgg3v3hfg70.cloudfront.net/TB8586/.jpg" alt=" -In the above
Q406: Which of the following helps determine the
Q407: According to the intertemporal substitution effect, when
Q408: <img src="https://d2lvgg3v3hfg70.cloudfront.net/TB5270/.jpg" alt=" -In the above
Q410: A movement along the aggregate demand curve
Q413: <img src="https://d2lvgg3v3hfg70.cloudfront.net/TB5270/.jpg" alt=" -The reason that
Q414: All of the following shift the short-
Q415: The short- run aggregate supply curve is
Q416: <img src="https://d2lvgg3v3hfg70.cloudfront.net/TB5270/.jpg" alt=" -An inflationary gap