Multiple Choice
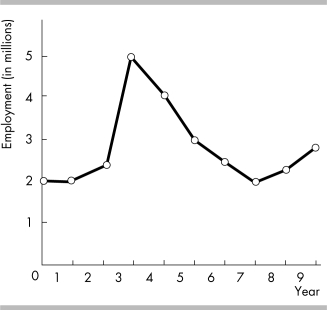
-According to the graph in the figure above, which year experienced the most rapid change in employment?
A) Year 2
B) Year 4
C) Year 5
D) Year 3
Correct Answer:

Verified
Correct Answer:
Verified
Related Questions
Q292: When the president of the Bank of
Q293: "The price of long distance phone calls
Q294: In the United States, the quality of
Q295: <img src="https://d2lvgg3v3hfg70.cloudfront.net/TB5270/.jpg" alt=" -The slope of
Q296: The opportunity cost of something you decide
Q299: Scarcity is a situation in which .<br>A)
Q300: If a curve falls and then rises,
Q301: <img src="https://d2lvgg3v3hfg70.cloudfront.net/TB5270/.jpg" alt=" -The above table
Q302: Which type of graph shows the values
Q359: To graph a relationship that involves more