Multiple Choice
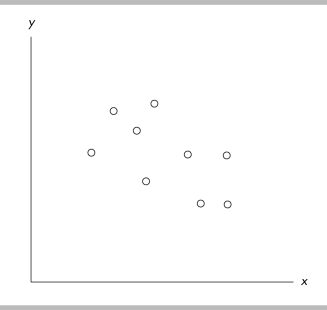
-The figure above is an example of a
A) scatter diagram.
B) cross- section graph.
C) time- series graph.
D) regression.
Correct Answer:

Verified
Correct Answer:
Verified
Q139: Chinaʹs population is about 1.5 billion, while
Q217: If an increase in x (the variable
Q287: <img src="https://d2lvgg3v3hfg70.cloudfront.net/TB6802/.jpg" alt=" -In the above
Q323: <img src="https://d2lvgg3v3hfg70.cloudfront.net/TB5270/.jpg" alt=" -The above table
Q326: <img src="https://d2lvgg3v3hfg70.cloudfront.net/TB5270/.jpg" alt=" -The table above
Q327: <img src="https://d2lvgg3v3hfg70.cloudfront.net/TB5270/.jpg" alt=" -In the above
Q330: The statement "Managers with a college education
Q331: You think that the volume of textiles
Q333: If you study 3 hours for an
Q391: <img src="https://d2lvgg3v3hfg70.cloudfront.net/TB8586/.jpg" alt=" -A graph has