Multiple Choice
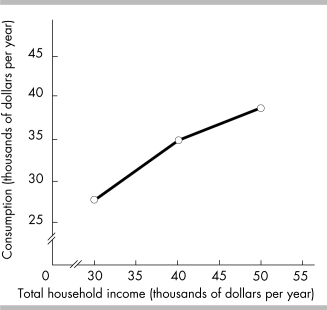
-The above figure shows the relationship between the Joneses' total consumption and total household income. The figure illustrates that the Joneses' total consumption varies
A) negatively with their income.
B) independently of their total household income.
C) inversely with their total household income.
D) directly with their total household income.
Correct Answer:

Verified
Correct Answer:
Verified
Q98: From 8 to 11 p.m., Sam can
Q202: A time series graph can show both
Q424: In the U.S. economy, a recent trend
Q425: Sue, who has a law degree, earns
Q427: Which of the following is an example
Q429: <img src="https://d2lvgg3v3hfg70.cloudfront.net/TB5270/.jpg" alt=" -In the above
Q430: Economics can be defined as the social
Q431: The slope of a straight line<br>A) is
Q432: A time- series graph displaying real GDP
Q433: The statement "The unemployment rate for teens