Multiple Choice
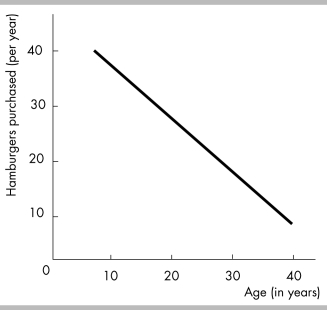
-The above figure depicts a
A) positive non- linear relationship between age and the number of hamburgers purchased per year.
B) positive linear relationship between age and the number of hamburgers purchased per year.
C) negative linear relationship between age and the number of hamburgers purchased per year.
D) negative non- linear relationship between age and the number of hamburgers purchased per year.
Correct Answer:

Verified
Correct Answer:
Verified
Q41: When I buy an $8.00 movie ticket
Q357: Which of the following is NOT a
Q359: <img src="https://d2lvgg3v3hfg70.cloudfront.net/TB5270/.jpg" alt=" -The above table
Q360: The fact that people with higher incomes
Q361: Using a graph to plot family incomes
Q363: "If you hire 1 worker, the worker
Q364: Suppose that for a curve, as the
Q365: <img src="https://d2lvgg3v3hfg70.cloudfront.net/TB5270/.jpg" alt=" -On a graph,
Q366: Entrepreneurs directly do all of the following
Q367: Whenever one variable increases, another variable decreases.