Multiple Choice
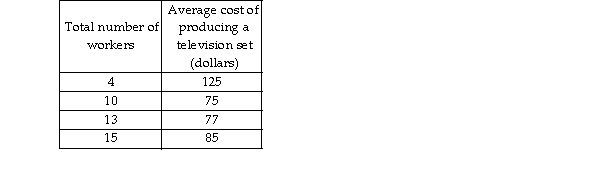
-Graphing the data in the above table with the number of workers on the horizontal axis and the average cost on the vertical axis, the graph would show
A) no relationship.
B) first a negative and then a positive relationship.
C) a horizontal line.
D) a linear relationship.
Correct Answer:

Verified
Correct Answer:
Verified
Q106: <img src="https://d2lvgg3v3hfg70.cloudfront.net/TB8586/.jpg" alt=" -The figure above
Q262: Explain whether the statement, "There is life
Q540: An art museum decides to offer tours
Q542: On a graph, an upward- sloping curve
Q543: As a curve approaches a maximum point,
Q544: Scarcity arises from<br>A) exploration.<br>B) limited wants and
Q546: Human resources that perform the functions of
Q547: Normative economic statements<br>A) describe the process of
Q548: Managers at Dell are deciding whether to
Q549: <img src="https://d2lvgg3v3hfg70.cloudfront.net/TB5270/.jpg" alt=" -In the above