Multiple Choice
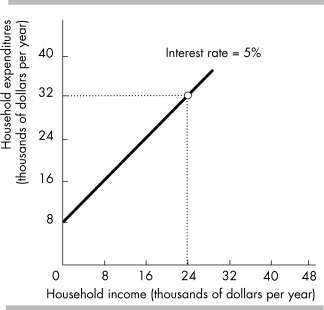
-In the above figure, the relationship between income and expenditures is
A) negative.
B) positive.
C) random.
D) independent.
Correct Answer:

Verified
Correct Answer:
Verified
Related Questions
Q299: Scarcity is a situation in which .<br>A)
Q300: If a curve falls and then rises,
Q301: <img src="https://d2lvgg3v3hfg70.cloudfront.net/TB5270/.jpg" alt=" -The above table
Q302: Which type of graph shows the values
Q304: Macroeconomics is the branch of economics that
Q305: You have data for average tax rates
Q306: Scarcity is a situation in which<br>A) most
Q307: "All children should have health insurance" is
Q308: <img src="https://d2lvgg3v3hfg70.cloudfront.net/TB5270/.jpg" alt=" -In the above
Q359: To graph a relationship that involves more