Multiple Choice
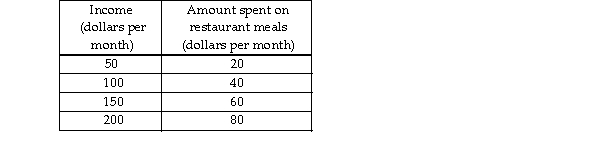
-Using the data in the above table, if income is on the x- axis and the amount spent on restaurant meals is on the y- axis, the graph of the two variables would be
A) horizontal.
B) upward sloping.
C) vertical.
D) downward sloping.
Correct Answer:

Verified
Correct Answer:
Verified
Q464: Keeping in mind economists' definition of factors
Q465: The faster an automobile is driven (speed),
Q466: The slope of a curved line can
Q467: <img src="https://d2lvgg3v3hfg70.cloudfront.net/TB5270/.jpg" alt=" -Which of the
Q468: <img src="https://d2lvgg3v3hfg70.cloudfront.net/TB5270/.jpg" alt=" -In the above
Q470: Which of the following statements are correct?<br>I.
Q471: The statement that _ is a positive
Q472: A time- series graph displays the price
Q473: Microeconomics is the study of .<br>A) the
Q474: The marginal benefit is the<br>A) additional cost