Essay
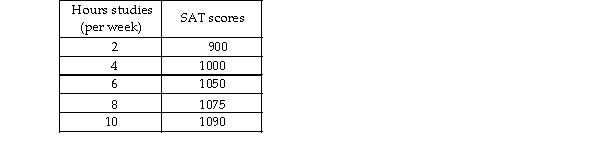
-Jamie is preparing to take his SAT tests. The table above shows how Jamie's score depends on the number of hou week Jamie studies.
a) Plot the relationship in the figure, putting the hours studied on the horizontal axis.
b) Is the relationship you plotted positive or negative?
c) What happens to the slope of the relationship as hours studied increase?
d) Suppose Jamie can enroll in an SAT prep course and, by so doing, for every possible number of hours he stu score will be 100 points higher. Plot the new relationship between the number of hours studied and Jamie's SAT the figure.
e) How many variables are involved in the figure you just completed?
Correct Answer:

Verified
 a) The figure above plots the relations...
View Answer
Unlock this answer now
Get Access to more Verified Answers free of charge
Correct Answer:
Verified
View Answer
Unlock this answer now
Get Access to more Verified Answers free of charge
Q411: Trend refers to<br>A) decreases but not increases
Q412: Economics is best defined as<br>A) making choices
Q413: Which of the following are true regarding
Q414: The term "direct relationship" means the same
Q415: A graph that shows the average income
Q417: Copper falls into which factor of production
Q418: Which of the following is a normative
Q419: A graph measures y on the vertical
Q420: <img src="https://d2lvgg3v3hfg70.cloudfront.net/TB5270/.jpg" alt=" -The figure above
Q421: U.S. producers decide to produce more compact