Multiple Choice
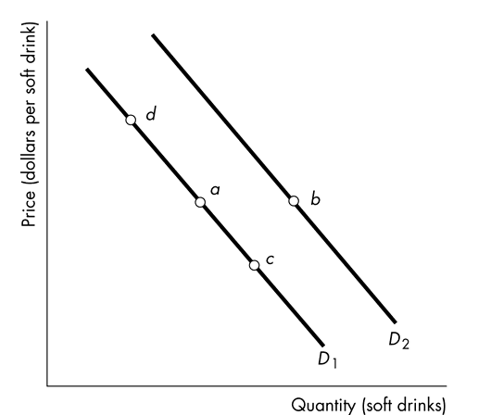
-Consider the demand curves for soft drinks shown in the figure above. Moving from point a to point c means that
A) the marginal benefit of each additional soft drink falls.
B) the opportunity cost of another soft drink increases.
C) the price of a soft drink has increased.
D) peopleʹs incomes have decreased.
Correct Answer:

Verified
Correct Answer:
Verified
Q41: <img src="https://d2lvgg3v3hfg70.cloudfront.net/TB8586/.jpg" alt=" -The above figures
Q180: All grapefruit juice producers have decided to
Q180: What is the difference between a money
Q181: Which of the following does NOT shift
Q183: Every spring, motorists do more driving than
Q186: If the price of a video download
Q187: If good growing conditions increase the supply
Q188: Twenty years ago a stove cost $300
Q189: Pizza and hamburgers are substitutes for consumers.
Q406: <img src="https://d2lvgg3v3hfg70.cloudfront.net/TB8586/.jpg" alt=" -Consider the demand