Multiple Choice
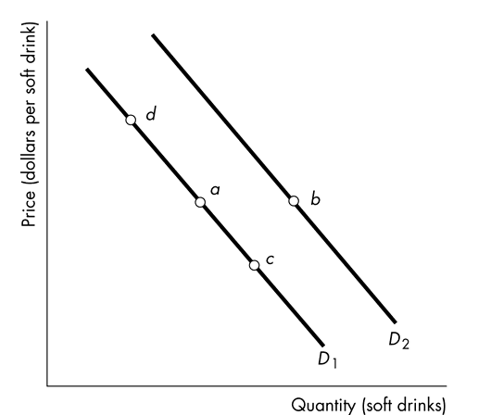
-Consider the demand curves for soft drinks shown in the figure above. A movement from point a
To point b represents
A) an increase in quantity demanded.
B) a decrease in quantity demanded.
C) an increase in demand.
D) a decrease in demand.
Correct Answer:

Verified
Correct Answer:
Verified
Q143: <img src="https://d2lvgg3v3hfg70.cloudfront.net/TB8586/.jpg" alt=" -The above figures
Q300: Which of the following increases the demand
Q301: If the demand curve for bottled water
Q302: Inferior goods are those for which demand
Q303: Consider the market for broccoli. If the
Q304: If the demand for digital cameras increases
Q306: A decrease in the price of bowling
Q307: <img src="https://d2lvgg3v3hfg70.cloudfront.net/TB6802/.jpg" alt=" -The figure above
Q308: When the price of an inferior good
Q309: In the market for magazines, the ʺincome