Multiple Choice
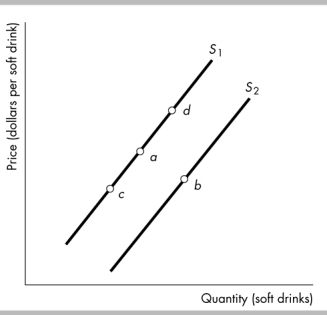
-The figure above shows supply curves for soft drinks. Suppose the economy is at point a. A movement to point b could be the result of
A) a decrease in the relative price of a soft drink.
B) an increase in the money price of a soft drink.
C) an increase in technology.
D) an increase in the relative price of a soft drink.
Correct Answer:

Verified
Correct Answer:
Verified
Q311: When both the demand for a good
Q380: If the demand curve for bottled water
Q381: The law of demand implies that demand
Q382: The Market for Wapanzo Beans<br><br>Quantity Demanded
Q384: <img src="https://d2lvgg3v3hfg70.cloudfront.net/TB6802/.jpg" alt=" -The figure illustrates
Q386: When there is a shortage in the
Q387: <img src="https://d2lvgg3v3hfg70.cloudfront.net/TB6802/.jpg" alt=" -In the above
Q388: If the price of chocolate chip cookies
Q389: Wants, as opposed to demands,<br>A) are the
Q390: Good A and good B are substitutes