Multiple Choice
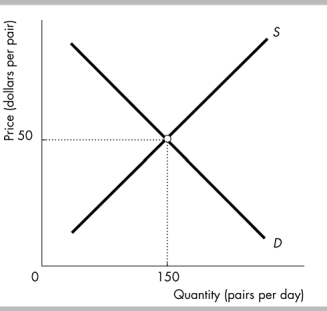
-The figure illustrates the demand for and supply for jeans. Suppose jeans are a normal good and peopleʹs incomes increase. At the initial price of $50 for a pair of jeans, after the increase in income the quantity demanded is__________ than the equilibrium quantity and there is a __________of jeans.
A) greater; shortage
B) less; shortage
C) greater; surplus
D) less; surplus
Correct Answer:

Verified
Correct Answer:
Verified
Q64: In March, the quantity of orange juice
Q66: If demand increases and supply decreases, what
Q67: You observe that in the market for
Q68: The price of jet fuel falls. This
Q70: During the last decade, the price of
Q71: If a market is <u>NOT</u> in
Q72: Ham and eggs are complements. If the
Q73: The opportunity cost of a hot dog
Q254: For consumers, chocolate chip cookies and doughnuts
Q274: <img src="https://d2lvgg3v3hfg70.cloudfront.net/TB8586/.jpg" alt=" -The above figures