Multiple Choice
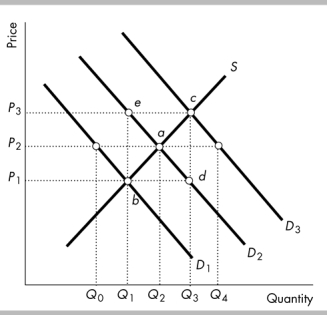
-In the above figure, a change in quantity supplied with unchanged supply is represented by a movement from
A) point a to point e.
B) point e to point c.
C) point b to point e.
D) point b to point a.
Correct Answer:

Verified
Correct Answer:
Verified
Q118: For a "change in the quantity supplied"
Q135: A demand curve is also a willingness-and-ability-to-pay
Q404: The initial supply and demand curves for
Q405: <img src="https://d2lvgg3v3hfg70.cloudfront.net/TB6802/.jpg" alt=" -The figure above
Q406: Using supply-and-demand diagrams, show and explain the
Q408: A shortage causes the<br>A) price to fall.<br>B)
Q410: <img src="https://d2lvgg3v3hfg70.cloudfront.net/TB6802/.jpg" alt=" -The figure above
Q412: Sweatshirts and tee-shirts are complements in consumption
Q413: When the price of a normal good
Q414: When the price of a good is<br>A)