Multiple Choice
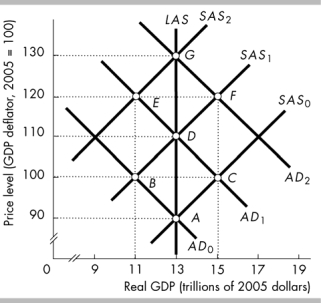
-In the above figure, which path represents a demand-pull inflation?
A) point A to B to D to F to G
B) point A to C to D to F to G
C) point A to C to D to E to G
D) point A to B to D to E to G
Correct Answer:

Verified
Correct Answer:
Verified
Related Questions
Q46: According to the new classical model, changes
Q47: One assumption of the new classical model
Q48: <img src="https://d2lvgg3v3hfg70.cloudfront.net/TB6802/.jpg" alt=" -The figure above
Q49: Which of the following could lead to
Q50: Demand pull inflation can be started by<br>A)
Q52: In the short run, an unexpected increase
Q53: Which of the following is the factor
Q54: A larger than expected increase in aggregate
Q55: Cost-push inflation can be started by<br>A) an
Q56: The short-run Phillips curve shows the tradeoff