Multiple Choice
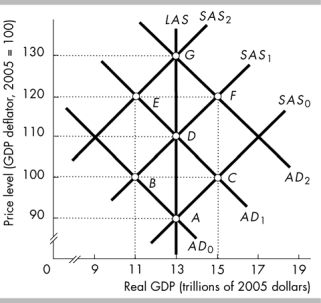
-In the above figure, which path represents a cost-push inflation?
A) point A to C to D to F to G
B) point A to B to D to F to G
C) point A to C to D to E to G
D) point A to B to D to E to G
Correct Answer:

Verified
Correct Answer:
Verified
Related Questions
Q61: During which decade did the United States
Q62: According to the new Keynesian cycle theory
Q64: Demand-pull inflation persists because of<br>A) continuing increases
Q65: The monetarist theory of the business cycle
Q67: If the natural unemployment rate increases, then
Q68: In the real business cycle framework, a
Q69: Which of the following is the factor
Q70: A leftward shift in the aggregate supply
Q153: If the short-run Phillips curve shifts rightward,
Q340: "The long-run Phillips curve is downward sloping."