Multiple Choice
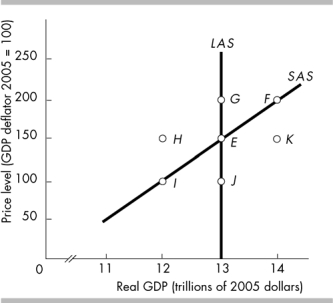
-In the above figure, which movement illustrates the impact of a constant price level and a rising money wage rate?
A) E to F
B) E to I
C) E to J
D) E to H
Correct Answer:

Verified
Correct Answer:
Verified
Q167: <img src="https://d2lvgg3v3hfg70.cloudfront.net/TB6802/.jpg" alt=" -Use the figure
Q168: The short-run aggregate supply curve shifts because
Q169: Which of the following changes would NOT
Q170: Suppose there is a temporary increase in
Q171: <img src="https://d2lvgg3v3hfg70.cloudfront.net/TB6802/.jpg" alt=" -The above figure
Q173: An increase in the quantity of capital
Q174: If the quantity of money increases, the<br>A)
Q175: In the short-run, a decrease in government
Q176: <img src="https://d2lvgg3v3hfg70.cloudfront.net/TB6802/.jpg" alt=" -In the above
Q177: <span class="ql-formula" data-value="\begin{array} { | l |