Multiple Choice
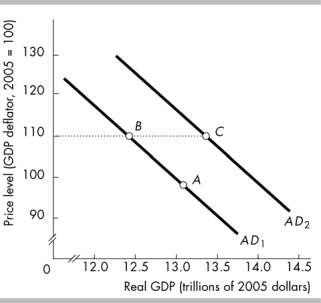
-In the above figure, the shift from point C to point B might be the result of
A) a decrease in the price level.
B) a decrease in government expenditures.
C) an increase in the quantity of money.
D) an increase in the price level.
Correct Answer:

Verified
Correct Answer:
Verified
Q401: The SAS curve shifts if there is
Q402: A change in _creates a movement along
Q403: <img src="https://d2lvgg3v3hfg70.cloudfront.net/TB6802/.jpg" alt=" -In the above
Q404: An increase in the money wage rate
Q405: <span class="ql-formula" data-value="\begin{array}{l}\text { Real GDP supplied
Q406: <img src="https://d2lvgg3v3hfg70.cloudfront.net/TB6802/.jpg" alt=" -Suppose the economy
Q407: By using only the aggregate demand curve,
Q408: Moving along the aggregate demand curve, a
Q409: In 2008, Japanʹs government approved a $1
Q411: A fall in the money wage rate