menu-iconExamlexExamLexServices

Discover

Ask a Question
  1. All Topics
  2. Topic
    Business
  3. Study Set
    Macroeconomics Study Set 41
  4. Exam
    Exam 10: Aggregate Supply and Aggregate Demand
  5. Question
    -In the Above Figure, the Inflationary Gap When AD<sub>2</sub><sub> </Sub>is
Solved

-In the Above Figure, the Inflationary Gap When AD2 is

Question 322

Question 322

Multiple Choice

  -In the above figure, the inflationary gap when AD<sub>2</sub><sub> </sub>is the aggregate demand curve equals A)  the difference between $12.5 trillion and $12.0 trillion. B)  LAS minus SAS at a price level of 100. C)  AD<sub>1</sub>. D)  the difference between 110 and 100.
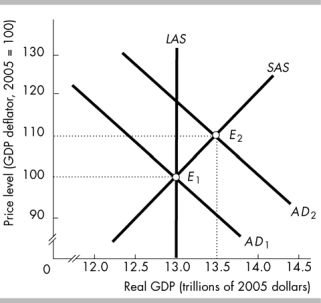
-In the above figure, the inflationary gap when AD2 is the aggregate demand curve equals


A) the difference between $12.5 trillion and $12.0 trillion.
B) LAS minus SAS at a price level of 100.
C) AD1.
D) the difference between 110 and 100.

Correct Answer:

verifed

Verified

Unlock this answer now
Get Access to more Verified Answers free of charge

Related Questions

Q221: The business cycle occurs because aggregate demand

Q244: In the short run, a supply shock

Q317: Starting at full employment, a business cycle

Q318: Moving along a short-run aggregate supply curve,

Q319: As the price level falls and other

Q321: One reason that the aggregate demand curve

Q323: China is one of the worldʹs largest

Q324: When the price level in France increases

Q325: <img src="https://d2lvgg3v3hfg70.cloudfront.net/TB6802/.jpg" alt=" -In the above

Q326: Compare the policy prescriptions of Keynesian, Classical,

Examlex

ExamLex

About UsContact UsPerks CenterHomeschoolingTest Prep

Work With Us

Campus RepresentativeInfluencers

Links

FaqPricingChrome Extension

Download The App

Get App StoreGet Google Play

Policies

Privacy PolicyTerms of ServiceHonor CodeCommunity Guidelines

Scan To Download

qr-code

Copyright © (2025) ExamLex LLC.

Privacy PolicyTerms Of ServiceHonor CodeCommunity Guidelines